[Work in Progress] While the conclusion might be right, the methodology of proving this needs to be re-worked. Due to time, knowledge and circumstantial limitation, it might take a couple more weeks for me to conclude this. Thanks for your interest - check back in a few weeks!!
TLDR Advice: I cannot make this any shorter than it is. If you want a quick read, read the methodology section and conclusion section (especially the chart), then the discussion. For your own suggestion to improve this system, please post in Part 2 of this thread.
Introduction
The Drop per kill hypothesis initially struck me as another “RNG superstition” and I did not bother to understand the significance of the topic. But when the topic stuck around for so long, I had to investigate it. Reading the thread quickly made me realize that most are unable to provide proof besides some anecdotal evidences.
This has led to continued debate of ToS’s drop system and makes it impossible to move to the next step - uniting the player base to address issues caused by the drop system.
This experiment intends to provide statistical evidence to prove or disprove the DPK hypothesis once and for all. A disclaimer is that I personally have a fairly distant memory of Statistics and my last lesson on it was many years ago. However, I have been consistently using statistics to analyzing drop rates in MMOs over the years, and have good conceptual understanding of binomial cumulative distributions. Therefore, please excuse me if I do not use the proper testing model and terminology, for those of you who are statistic majors or experts. Any suggestions for editing the presentation is welcome.
Note: DPK hypothesis does not claim that it is the UNIVERSAL drop system used in ToS, it is only claimed for a subset of item drops.
Hypothesis
Null hypothesis: ToS uses a random drop system with fixed percentage chance of success, with each attempt independent from each other. This is usually simulated using a (pseudo) Random Number Generator (RNG).
Alternate hypothesis: ToS uses a NON-Random Drop system, where the drop is predictable (has a pattern), and each attempt is dependent on each other. An example of such system is a counter based system as suggested by the DPK hypothesis.
Methodology
The easiest way to prove a non random drop system is to demonstrate a variable drop rate observed by different players. If the drop system is random, each player will observe the same drop rate, because each attempt is independent and has a fixed chance of success.
Therefore, the experiment I have designed, first attempts to estimate the true drop rate within a 95% confidence interval. Once that is determined, I would test it against two characters using a farming pattern, and see if they share the same observed drop chance.
A binomial distribution calculator was used for this project. It might help you understand the math behind this experiment too, if you are interested here is the link to stattrek binomial calculator.
Part 1:
Determining the true drop rate of Crude Short Bow (CSB) from Pokubu
I farmed 1175 Pokubu in Ch 5 after the initial control CSB dropped. During my attempt to acquire the first CSB (after the control), a player interfered with the experiment and refused to switch channel and competed for some Pokubu kills. I have elected to discard this first data point to ease analysis / reduce complexity. (An additional analysis will be made later that takes in this data point into consideration for those of you who might criticize me for cherry picking data.) This leaves me with 999 kills with 5 successes.
Edit: The calculator used to find these Clopper-Pearson Intervals can be found in appendix 2 at the bottom of this post.
To estimate the true drop rate I have calculated using a binomial cumulative distribution of the following parameters:
Assuming a random drop rate
Probability of success in a single trial: Unknown x%
No. of trials: 999
No. of successes: 5
To find the lower limit of the true drop rate, I calculated for the probability of success in a single trial (x%) where getting 5 or more successes is less than 2.5% chance. This turned out to be 0.1627%. i.e.
Probability of success in a single trial: 0.001627
No. of trials: 999
No. of successes: 5
P(X>=5) = 0.02500
Similarly, for the upper limit of true drop rate was determined to be 1.164%
Probability of success in a single trial: 0.01164
No. of trials: 999
No. of successes: 5
P(X<=5) = 0.02500
Therefore I concluded that the true drop rate must be between 0.1627% - 1.164% with 95% confidence.
With this information I proceeded to part 2 of the test.
Part 2:
Comparing drop rate against 2 characters with a farming pattern.
The DPK hypothesis suggested that the non-random drop rate used a count based system. To accentuate this effect I used my wizard to farm 190 (minimum interval during initial testing was 192), then using my cleric to farm until I get the CSB.
The results were as follows:
Wizard
Initial control kill count: 1653
Stopped at: 1843
Interval kills: 190
CSB: 0
Switching to cleric
Initial kill count: 4
Stopped at: 19
Interval kills: 15
CSB: 1
Back to Wizard (During this section a silver pokubu appeared and dropped a CSB at kill 1848)
Initial kill count: 1843
Stopped at: 2033
Interval kills: 190
CSB: 0 (1 from silver mob during kill 1848, omitted as not relevant to current analysis)
Cleric
Initial Kill count: 19
Stopped at: 30
Interval Kills: 11
CSB: 1
Wizard
Initial kill count: 2033
Stopped at: 2223
Interval Kills: 190
CSB: 0
Cleric
Initial Kill count: 30
Stopped at: 39
Interval Kills: 9
CSB: 1
(A bot came in during this section and took anywhere from 2-10 kills, I tried to KS as much as I could before he left)
Wizard
Initial Kill count: 2223
Stopped at: 2413
Interval Kills: 190
CSB: 0
Cleric
Initial Kill count: 39
Stopped at: 40
Interval Kills: 1
CSB: 1
Wizard
Initial Kill count: 2413
Stopped at: 2603
Interval Kills: 190
CSB: 0
Cleric
Initial Kill count: 40
Stopped at: 43
Interval Kills: 3
CSB: 1
Results summary of Part 2 tests:
Wizard
Total kills: 950
CSB: 0 (1 from silver mob)
Cleric
Total kills: 39
CSB: 5
Wizard
To determine the lower limit of the observed drop rate I calculated for the the probability of success in a single trial where getting 0 successes is 97.5%. This turned out to be 0.002665%.
Probability of success in single trial: 0.00002665
No. of trials: 950
No. of success: 0
P(X=0) = 0.9750
And the upper limit of the observed drop rate is: 0.3876%
Probablity of success in a single trial: 0.003876
No. of trials: 950
No. of success: 0
P(X=0) = 0.02499
Therefore I conclude that the observed drop rate of my wizard must be between 0.002665% - 0.3876% with 95% confidence.
Cleric
Similarly, the lower limit for the observed drop rate for my cleric is 4.297%
Probability of success in a single trial: 0.04297
No. of trials: 39
No. of success: 5
P(X>=5) = 0.02500
and the upper limit is 27.43%
Probablity of success in a single trial: 0.2743
No. of trials: 39
No. of success: 5
P(X<=5) = 0.02500
Therefore I conclude that the observed drop rate of my cleric must be between 4.297% - 27.43% with 95% confidence.
Conclusion:
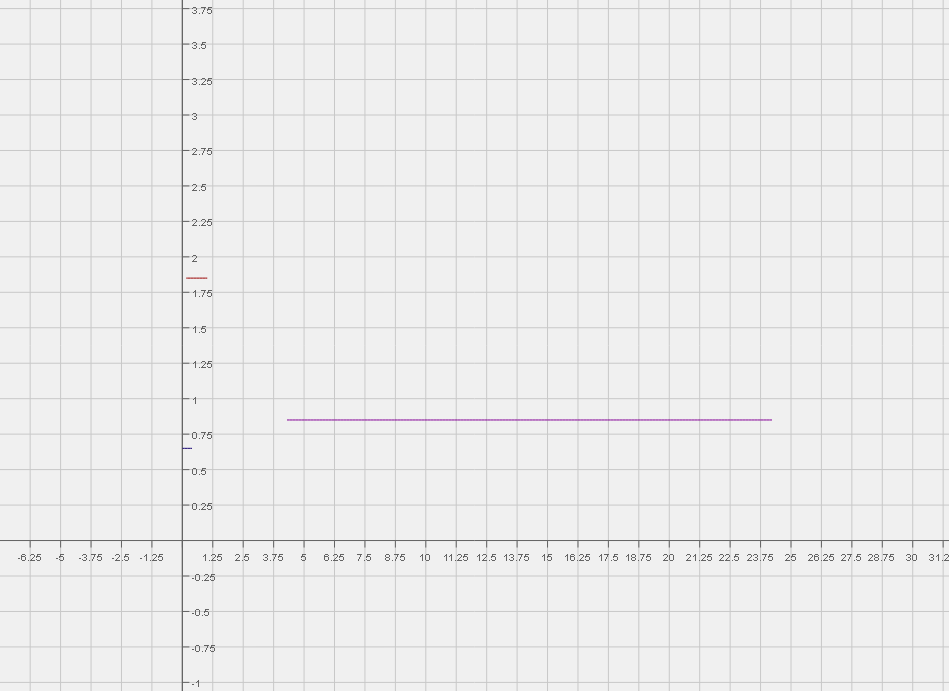
Legend:
- The Red line is the estimated true drop rate (top most: close to y=2)
- The blue line is Wizard’s observed drop chance (bottom most: close to y=0.75, spans from essentially 0 - 0.39)
- The pink line is Cleric’s Observed drop chance (the longest line to the right)
Interpretation:
- Notice how the blue line and pink line do not overlap (wizard and cleric do not share the same observed drop rate)
- Notice how the pink line is outside the range of the red line. (cleric drop observed drop rate is higher than estimated true drop rate)
As you can see the upper limit of my wizard’s drop rate in the test is 0.3876% which is significantly lower than the lower limit of my cleric’s observed drop rate of 4.297%. Therefore I conclude that the observed drop rate of my wizard and cleric using the test pattern IS NOT THE SAME (with 95% confidence). The difference of 0.3976% to 4.297% is an order of magnitude away. It is extremely unlikely that this result is due to chance alone. The null hypothesis has been rejected and the alternative hypothesis is accepted.
Since using a farming pattern described in part 2 resulted in dissimilar observed drop rate. I can confidently say that the CSB drop rate of Pokobu IS NOT RANDOM. A non independent / variable drop rate system is in place for CSB.
Discussion
This experiment favors heavily for the DPK hypothesis. We know that drop rate is not random and that a patterned farming system can fully exploit an item’s drop, my wizard got nothing for farming 950 Pokubu and my cleric got 5 for farming 39, by understanding the drop pattern.
There is a couple of problem that is raised from this revelation:
Every Pokubu (or other DPK mob) is NOT THE SAME
The first 190 Pokubu has a CSB drop chance of essentially 0%. While the Pokubu from 190-210 has a cumulative CSB drop chance of essentially 100%. This is not a fair dropping mechanic as it can be EXPLOITED. As demonstrated by my cleric who understands DPK drop rate patterns. She got everything; while my poor wiz got nothing for all that work.
An extremely high DPK count combined with low farm rate monsters create an essentially 0% drop rate
In a scenario where DPK count do not save past server reset. If the critical DPK count can never be reached before the count is reset to 0.
Continued:
Suggestions are detailed in a part 2 of this thread.
@hkkim this is the first time I tagged you to read my post. As I think it is critically important that you understand the severity of the design choice your team has taken. Please reconsider you drop system in place and implement something that is far less exploitable.
Special Credit to @harumi @lordshredder @takemi for suggesting mobs to test with. And to @bald_dad for first noticing the issue and posting the origninal DPK thread. And thanks to anyone I missed mentioning here, that had contribued to our understanding of the workings (and flaws) of the DPK system.
Appendix: I have the Screen Shot of every step of this test. I did not post them as I thought it is already a huge post for what counts. For skeptics, PM me for the Screen Shot evidence.
Appendix 2: Due to critics of my original confidence intervals I hereby provide you with the online calculator to calculate the Clopper-Pearson Interval (with 95% confidence level) yourself.