Not sure if this belongs in general discussion , pls tell me if I gotta move this elsewhere
TL;DR: 0.3(crit rate/crit res of mob) - 0.2 (capped at 0.5) estimates crit chance decently well especially at mid-high crit rate/crit res ratios (>=1.0). Seems to break down at lower ratios. Common forum formula and altarget addon are probably wrong
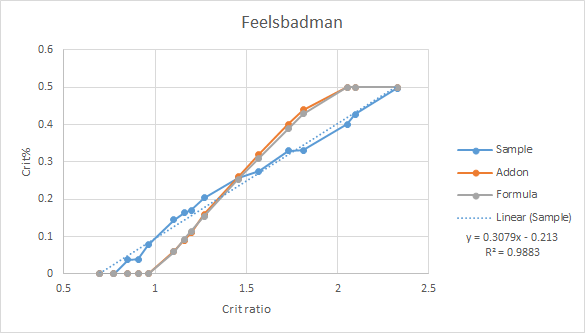
Graph
- Terms
crit res = Critical resistance
crit rate = Critical rate
crit% = Critical chance
crit ratio = crit rate/crit resistance
addon (formula) = crit% altarget addon
common forum formula = (crit ratio)^0.6 - 1, capped at 0.5
linear/guessed formula = 0.3(crit rate/crit res of mob) - 0.2, capped at 0.5
- Testing method
a. Used lv 14 zaibas (18 hits) on different types of mobs, messed around with crit rate by unequipping items as well.
b. Take note of damage dealt for crits and non-crits.
c. Use all 3 OHs of zaibas on a mob with full hp, see how much hp is left
d. Repeat on 10 mobs for each kind of mob. Total hits is 540 (18hits x 3 OHs x 10 mobs)
e. Was using plate set, so crit cap is at 50%.
- Common forum formua + altarget addon
At first, I was testing the 2 most common ways of determining crit%: the Altarget addon, and the formula (crit ratio)^0.6 - 1, capped at 0.5.
Few things I noticed:
- Formula and addon tends to give similar crit%, likely they are using similar formulas to determine the crit%
- Both formula and addon gave very wrong results, esp at higher crit ratios
Conclusion: Formula and addon are definitely wrong (see graph above)
- Why linear formula
During Re:Build season, this was posted in news:
It included this graph:
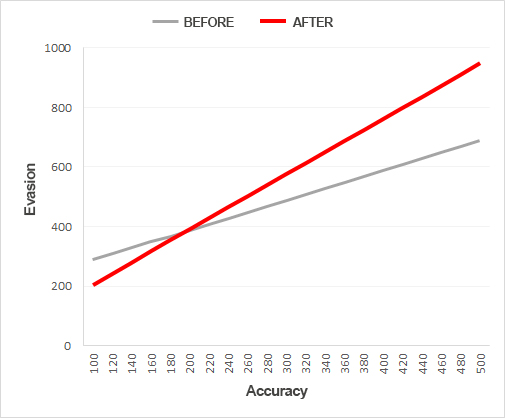
The graph description was “Evasion values required to maintain the same evasion rate in relation to the opponent’s accuracy, before and after the update.”
Graph was also stated to be similar to crit%, but with different factors and values.
I’m guessing the graph was produced by setting a value, e.g. 20%, and then seeing the accuracy/evasion required to hit that value. I THINK the graph supports a linear relationship between crit% and crit ratio (proof in section 8, with other technical-ish stuff).
This plus the linear graph fitting pretty well in excel kinda just made me move towards a linear formula.
Other fits in excel did not work as well, but of course it’s possible actual formula is a fit not present in excel (e.g. powers, combination of exponential and linear).
5. Coefficient/constant of formula
When i did the linear trendline in excel, the coefficient seemed to fluctuate around 0.28 - 0.31, and the constant around -0.21 - -0.17, I’m just guessing 0.3 and -0.2 because I’m guessing IMC would probably use nice, round numbers lol.
So this gives final formula in the TL;DR:
0.3(crit rate/crit res of mob) - 0.2 (capped at 0.5)
6. Breakdown at lower crit ratios
The linear formula breaks down at lower crit ratios (confirmed statistically, technical-ish stuff in section 8). 2 possible reasons are:
- Lower crit% means greater variance when testing
- Coefficient/constant in formula is slightly wrong.
I’m leaning towards 2, because 540 hits is a pretty good sample even at the predicted 3%-ish crit rates I tested imo.
It’s difficult to determine the exact coefficient and formula because of the lower cap at 0%, and upper cap at 50%, and it’s hard to pinpoint where exactly those caps happen.
E.g. A crit ratio that gives a 70% crit% will still show up as 50% when testing, meaning you have to guess if crit% is exactly 50%, or is actually something higher but is capped.
7. Conclusion
Formula of 0.3(crit rate/crit res of mob) - 0.2 (capped at 0.5) may be the actual formula used to determine crit%, and not the addon formula/common forum formula.
Even if it’s not the actual formula, it’s a decent estimate especially at any crit ratio above 1.
8. Technical-ish stuff
Why rebuild post supports linear relationship
Let y = m(a/b) + c, where y = crit%, a = crit rate, b = crit res.
If y is taken to be a constant to derive the graph of b against a,
y - c = m(a/b)
b(y-c) = ma
b = (m/(y-c))a, which matches with the rebuild post graph being linear.
Flaw: This suggests a y-intercept of 0, which does not appear to be the case in the rebuild graph 
Statistics and stuff
I’m pretty bad at statistics, so please correct me if I did anything wrong lel.
Population distribution is binomial, but sample population is estimated to be a normal distribution by central limit theory (CLT). To my knowledge, any sample size above 30 can be CLT-ed to some degree, but ensured that min(np, n(1-p))> 5, as per this random article anyways:
http://sphweb.bumc.bu.edu/otlt/MPH-Modules/BS/BS704_Probability/BS704_Probability12.html
Testing of formula was 2-tailed, done at 0.05 significance.
Null hypothesis is either the addon, common forum formula, or the linear formula.
Addon and common forum formula both rejected consistently except around 1.4-ish crit ratio (the intersection on the graphs).
Linear formula starts getting some rejections at crit ratios < 1.0.
XML file from excel with data (no graphs, scripts etc.):
Crit rate.xml (218.9 KB)